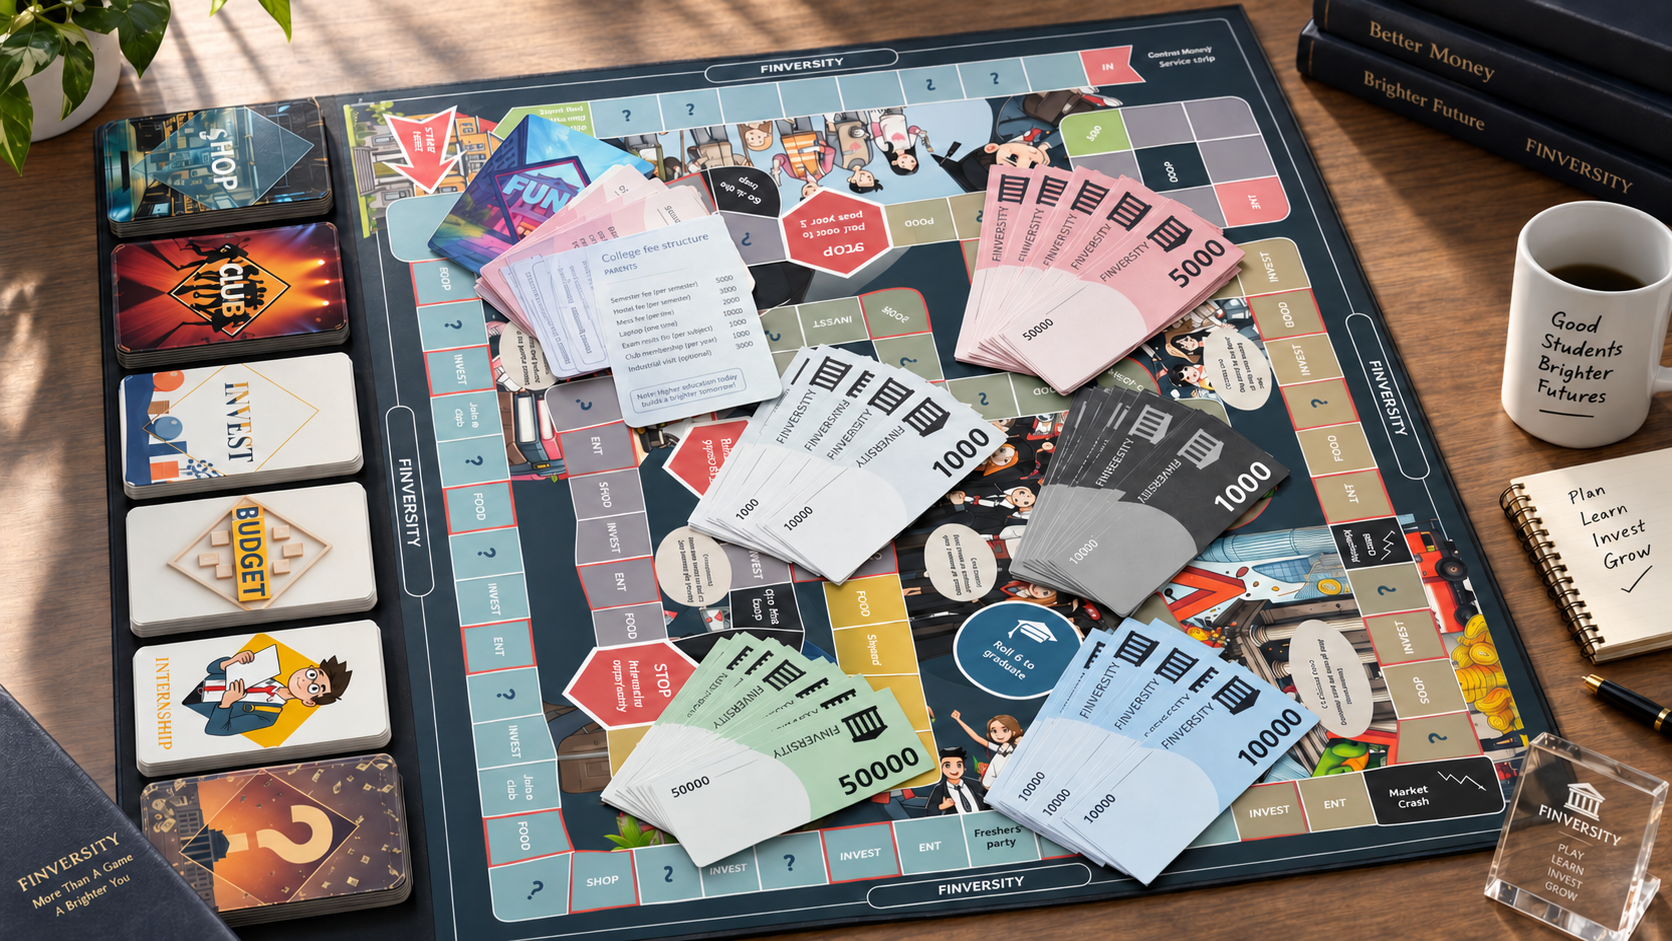
Financial choices become tangible through the board, cards, and rules.
01 / THE QUESTION
How do financial choices become something students can practice?
The project began with a gap between available financial resources and students’ ability to use them. I focused on the decisions of college life—income, spending, saving, and investing—and investigated both reported habits and demonstrated knowledge before choosing an intervention.
B.Des project · IIT Bombay · Guided by Prof. Aman Xaxa
Research, game design, prototyping, and evaluation.Individual B.Des project · Guided by Prof. Aman Xaxa.
358behavioral-survey participants
369baseline quiz participants
75post-game evaluation participants
02 / THE RESEARCH
Build an evidence base. Then build the game.
REPORTED ≠ DEMONSTRATED ≠ OBSERVED
One question needed more than one kind of evidence.
01
Behavioral survey · n = 358
Reported behavior
What do students say they do?
Revealed
Patterns in spending, saving, budgeting, and financial anxiety.
Next evidence layer
Read alongside the separate quiz to distinguish reported habits from demonstrated understanding.
02
15-point quiz · n = 369
Demonstrated knowledge
Which financial concepts can students apply?
Revealed
A separate baseline of knowledge and topic gaps.
Next evidence layer
Observed play added context around financial choices and their consequences.
03
Iterative paper playtests
Observed decisions
What prevents the experience from working?
Revealed
Cash-flow problems, inaccessible investment choices, and rule confusion.
Next evidence layer
Expanded knowledge evaluation followed; a matched study would examine learning and retention.
THE BEHAVIORAL GAP
Knowing the intention was not knowing the habit.
84%
Lacked an emergency-saving habit
55%
Budgeted expenses
15%
Followed a budget regularly
Survey themes and percentages: P1 report, pages 19–26. Participant total standardized to the later author-supplied correction (358). The baseline quiz is a separate sample.
THE METHOD BECAME A DESIGN DECISION
Give the choice a consequence.
The board game was selected for shared decisions, negotiation, and visible consequences in a recognizable college setting. Comparing learning and engagement across formats would test that design rationale.
Trade-off: physical materials and group access. Expert conversations informed the financial context; observed play shaped the mechanics.
03 / THE DECISIONS
EVIDENCE → DECISION → PROTOTYPE
The observation changed the rule.
The paper version made friction visible while changes were still inexpensive.
01 / Starting funds
₹1,000–₹2,000
Observed
Gameplay stalled before meaningful choices were possible.
Interpreted
The resources constrained the learning opportunity.
CHANGED
₹4,000–₹5,000
More starting cash made budget cards and continued play feasible.
02 / Investment access
₹50,000 minimum
Observed
The decision existed on the board, but remained out of reach.
Interpreted
An inaccessible option cannot be meaningfully practiced.
CHANGED
₹20,000 minimum
Lower the threshold so players could encounter the investment choice.
03 / Rule clarity
Ambiguous actions
Observed
Players needed help understanding permissible actions and turns.
Borrowing and repayment were difficult to keep visible during play.
Interpreted
Invisible state increased the effort of playing.
CHANGED
−₹1,000 cards
Make outstanding credit tangible at the table.
THE REFINED PROTOTYPE
From rules on paper to decisions at the table.
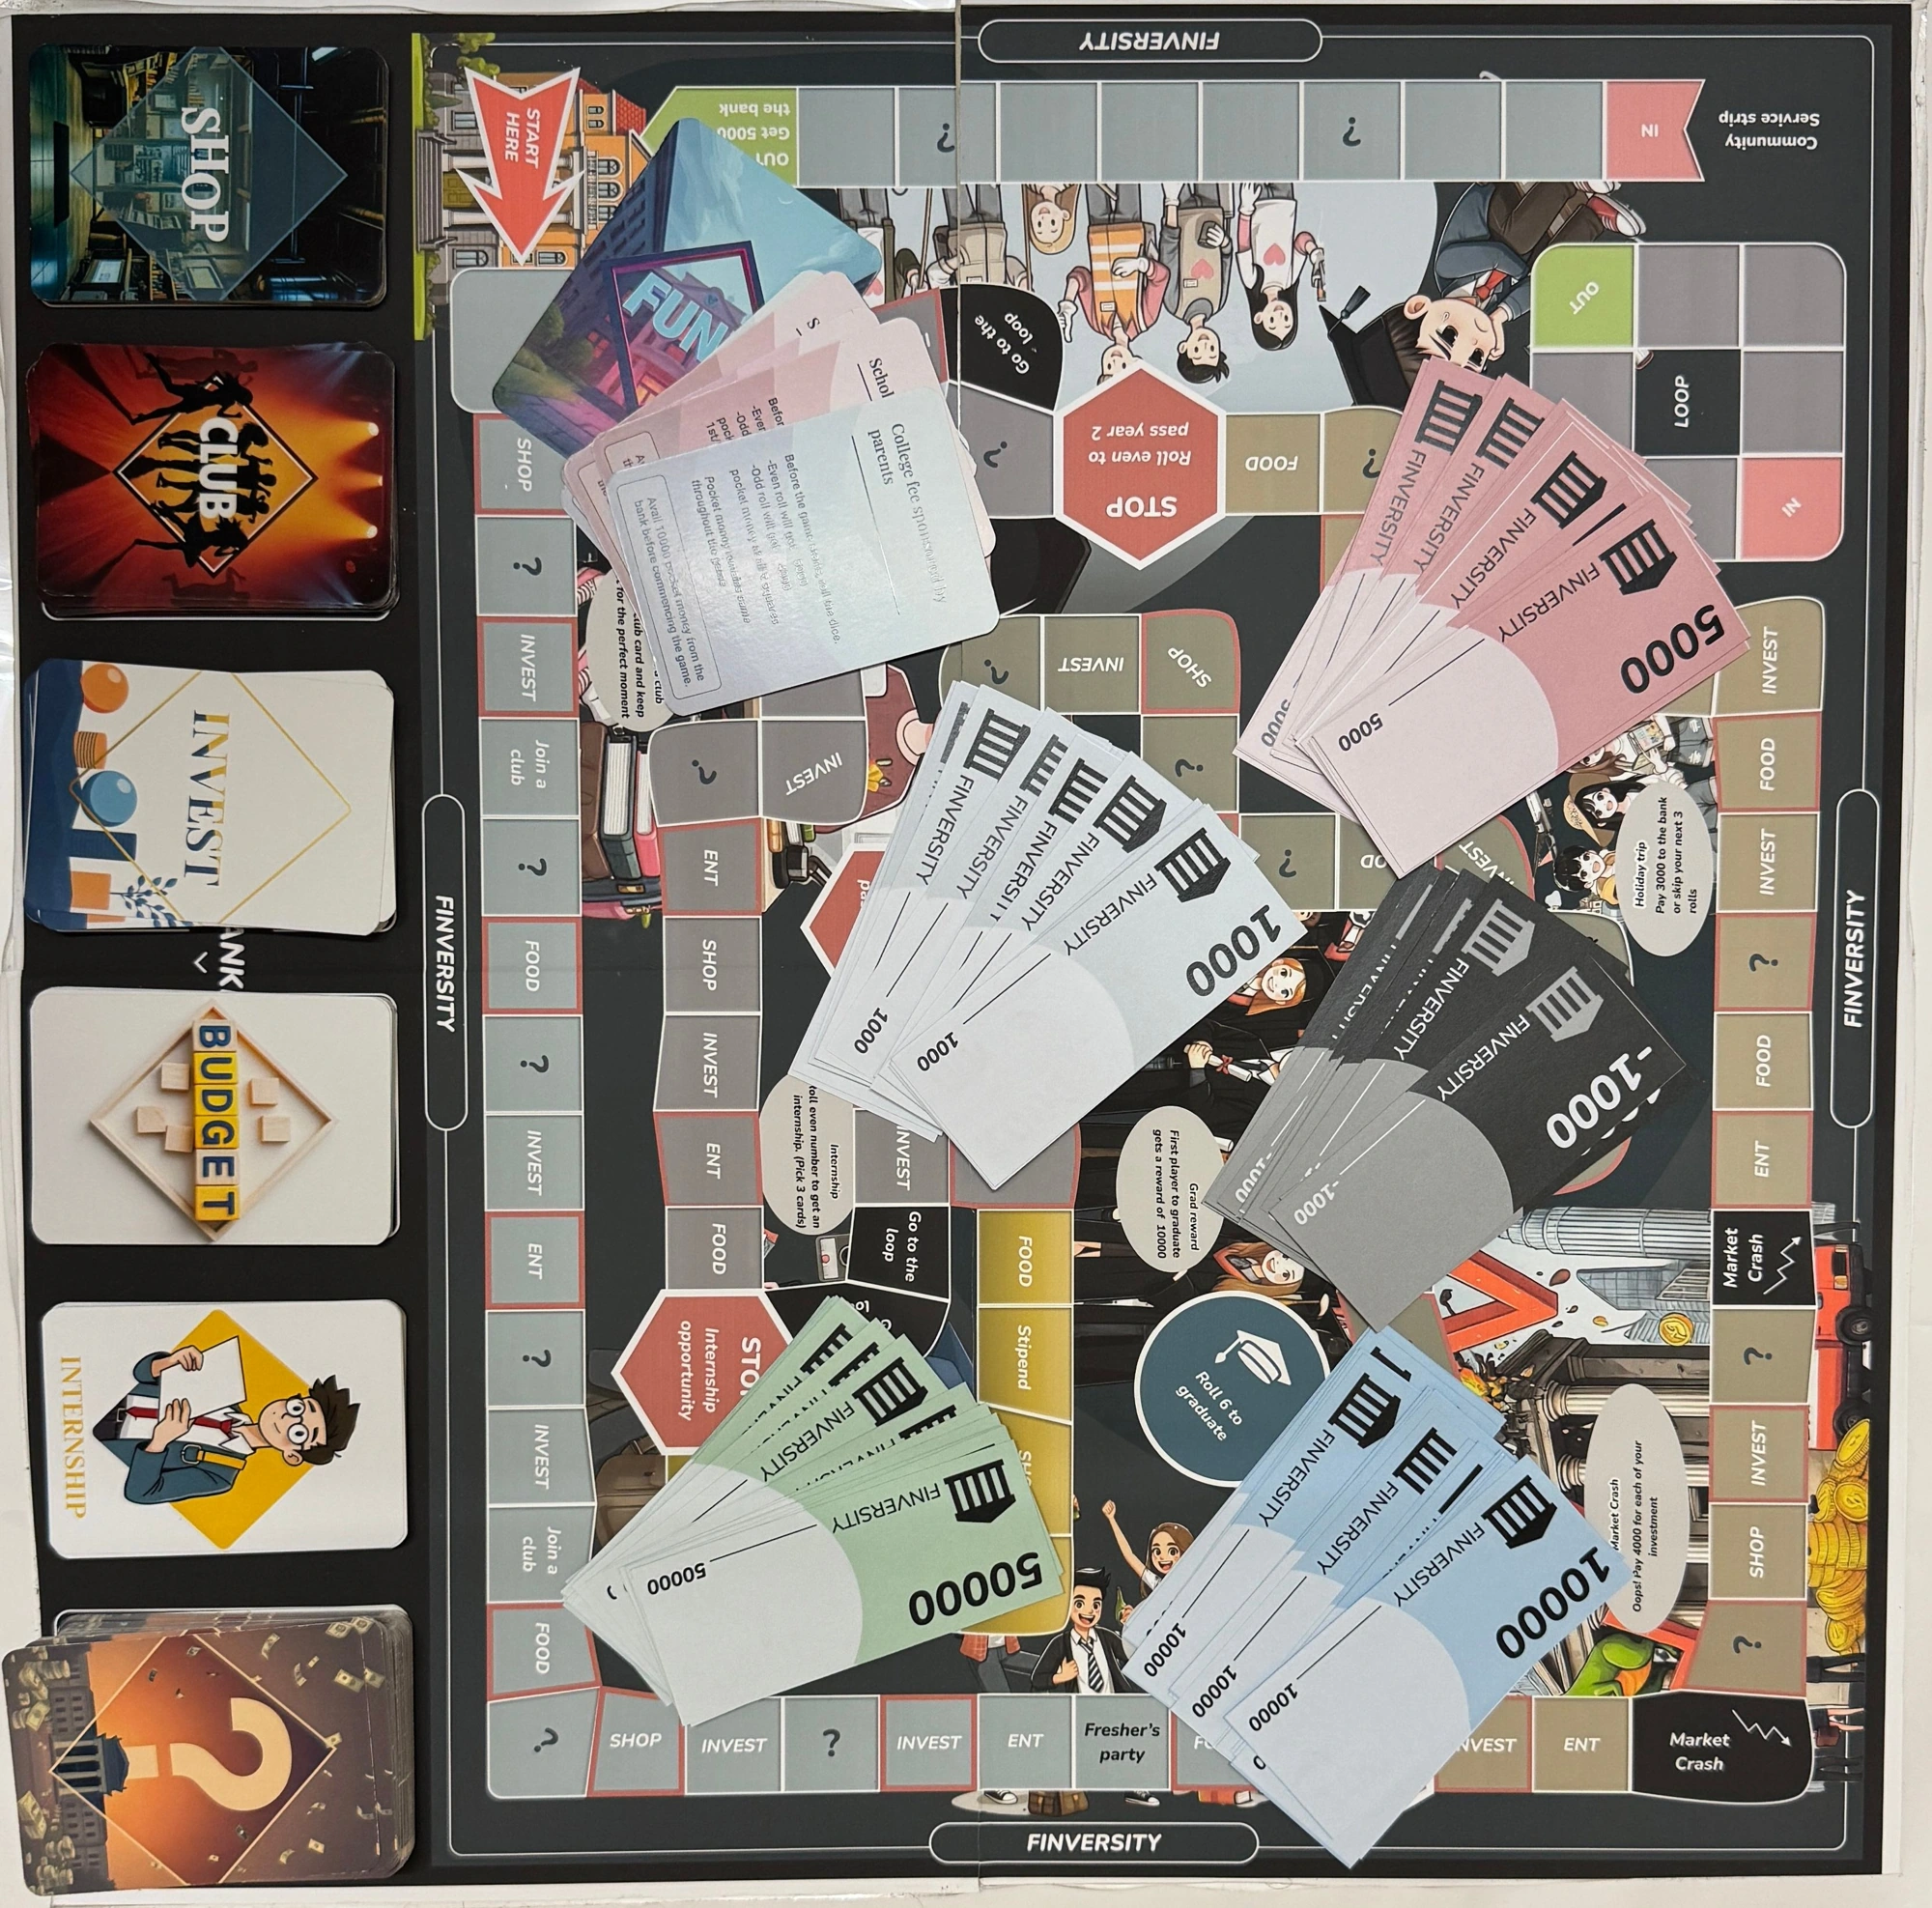
Community service offered a path when cash ran out. Pocket-money indicators and negative-value cards made the game’s financial state easier to read.
Now the question could move from whether play worked to what the post-game group knew.
P1 prototype iterations, PDF pages 33–37. Observed play informed a coordinated set of changes to resources, instructions, investment access, and credit visibility.
04 / THE REFLECTION
What happened after play?
EXPANDED POST-GAME EVALUATION
A stronger signal— with a clear boundary.
01 / THE EVALUATION GREW
13Iterative prototype testing
13 participants helped examine gameplay friction, rule clarity, pacing, and balance before the expanded knowledge evaluation.
75Expanded post-game evaluation
A later sample, using the same 15-point financial-literacy quiz structure.
01
Prototype testing
Observe gameplay friction
02
Rule refinement
Adjust mechanics and clarity
03
Expanded evaluation
75 post-game participants
04
Knowledge comparison
7.72 vs. 4.38 / 15
05
Interpretation
Strong signal; no causal proof
02 / THE POST-GAME GROUP SCORED HIGHER
Earlier baseline
4.38/ 15
n = 369 · Different participants
Post-game evaluation
7.72/ 15
n = 75 · After experiencing Finversity
Δ = +3.34 points Between the two group means
03 / THE STATISTICAL DIFFERENCE WAS LARGE
+3.34 points
95% confidence interval [2.60, 4.08]
Welch’s t ≈ 8.9
Independent-group comparison p < .001
Cohen’s d ≈ 1.15
The distance between the group means was about 1.15 pooled standard deviations.
A large standardized difference describes the separation between these samples. Statistical significance does not remove selection differences or establish causality.
04 / BEYOND THE AVERAGE
The median was higher, too.
Median 4 in the baseline sample; 7 in the post-game group. The middle half of post-game scores lay between 6 and 9. The descriptive signal extends beyond the mean, although these summaries do not reveal the complete distribution.
Earlier baselinen = 369 · SD ≈ 2.88
Median 4
Range 0–15 · Quartiles not supplied
Post-game evaluationn = 75 · SD = 2.97
Median 7
Range 1–14 · Q1 6 · Q3 9 · IQR 3 · Mode 6
03691215
Quiz score / 15. Lines show minimum to maximum; the post-game box shows the middle 50%. No baseline quartiles or individual-level scores were supplied, so no baseline box or distribution shape is inferred.Read the descriptive statistics
Separate samples, shared 15-point quiz structure
Measure
Earlier baseline
Post-game
Participants
369
75
Mean
≈ 4.38
7.72
Median
4
7
Mode
Not supplied
6
Standard deviation
≈ 2.88
2.97
Variance
Not supplied
8.80
Minimum
0
1
Maximum
15
14
Q1
Not supplied
6
Q3
Not supplied
9
IQR
Not supplied
3
05 / AN EARLIER TOPIC-LEVEL OBSERVATION
The strongest learning signal appeared where players had to make the decision themselves.
DIRECTLY REPRESENTED IN PLAY
Investments Credit
Choices, trade-offs, and consequences were part of the game. The earlier evaluation reported its strongest topic-level signal here.
LARGELY OUTSIDE THE GAME
Taxation General banking
Limited gameplay exposure aligned with little or no comparable signal.
This alignment comes from the earlier report’s topic analysis. A topic-level breakdown for the expanded 75-person sample was not supplied. The pattern is suggestive; it does not establish a causal mechanism.
06 / STRONGER EVIDENCE. THE SAME STUDY BOUNDARY.
What the data supports
The post-game group scored substantially higher than the earlier baseline sample.
The difference was large relative to within-group variation.
The expanded evaluation provides a stronger signal than the earlier small prototype test.
The result supports continued testing of game-based financial-literacy learning.
What it does not prove
Individual pre-to-post improvement.
That Finversity caused the score difference.
That the samples were otherwise comparable.
The conclusions of a randomized controlled experiment.
07 / WHAT I WOULD DO NEXT
Change the design of the study. Not just the size of the sample.
Measure the same participants before and after.
Include a control or comparison condition, with random assignment where feasible.
Plan an adequate sample for the intended comparison.
Examine topic-level understanding.
Add a delayed follow-up to test retention.
The expanded evaluation changed how I interpreted Finversity’s outcome. With 75 post-game participants, the knowledge difference became more substantial. But increasing the sample did not change the study design: the groups were still independent.
The result gives the next study a clear direction: examine individual learning through a matched or randomized design, then follow retention over time.
The signal became stronger. The boundary remained just as important.
Sources: original P1 report for the baseline and earlier prototype/topic observations; later evaluation statistics, corrected survey count, and preference-poll context supplied by Arjun, September 2026. Inferential statistics are approximate and consistent with the supplied summary values.
05 / THE WORK
A closer look.
The ideas, interfaces, and tools that carry the work forward.
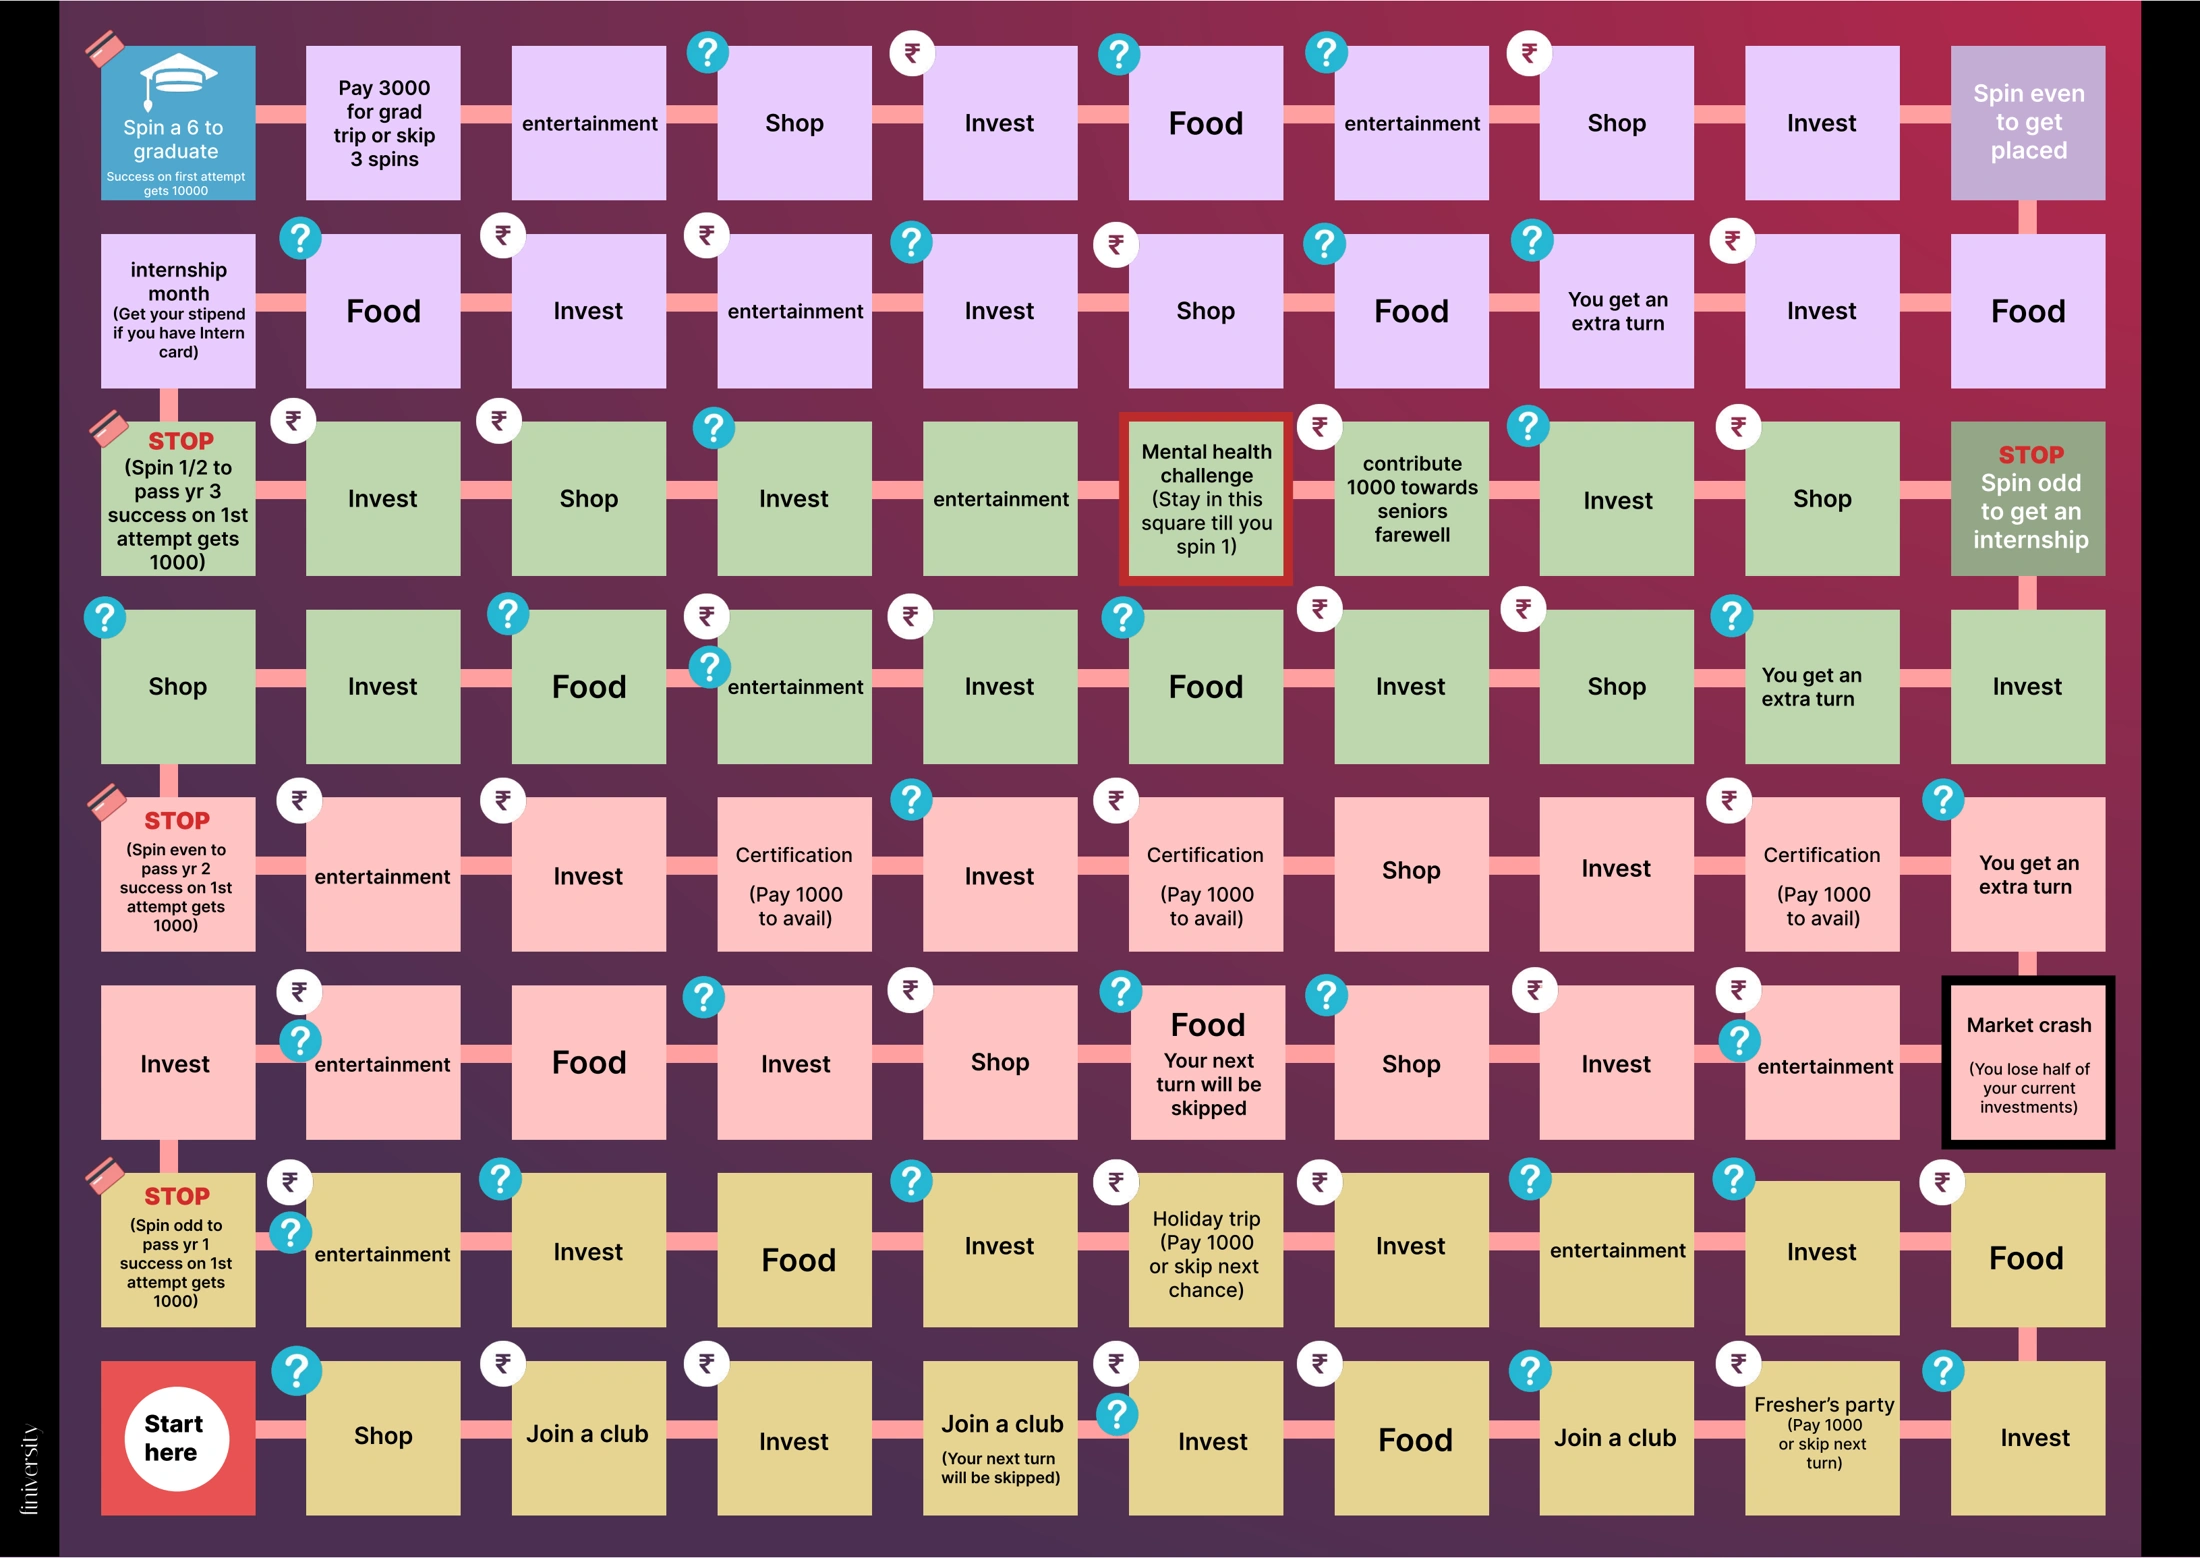
01The final board and card system, photographed as a physical prototype.02An early board layout: a working system for testing choices, rules, and pacing.03A rulebook that carries the structure of the game into play.
Sources: P1 report for research, game development and earlier prototype testing; updated author-supplied participant counts and expanded evaluation (September 2026). The later update supersedes counts and final-evaluation figures in the original report.